Tuesday, July 21, 2015

Milk for powdery mildew

Powdery mildew is becoming a problem on the cucurbits and kale in the campus terrace gardens.
  
Powdery mildew on zucchini leaf

Powdery mildew on kale leaf

The disease is most severe in warm, dry weather with high relative humidity. Young, succulent leaves and plants growing in nitrogen-rich soil are most prone to infection. 

The class observed the most severe infection at the east end of the west terraces, where the squash vines are particularly large and vigorous.

Leaf wetness actually prevents infection. Our recent switch from a sprinkler irrigation system to a drip irrigation system probably made the gardens more susceptible to powdery mildew by eliminating periods of leaf wetness.

Milk can be more effective than commercial fungicides in controlling powdery mildew on cucurbits. The students pruned out infected leaves to remove sources of inoculum and increase air flow through the plants, and then sprayed the remaining leaves with a 40% solution of milk in water. They will continue to spray milk once or twice each week.


Compost trial

Introduction

Compostable organics, such as food waste, accounted for 36% of Metro Vancouver's garbage in 2013. Sending compostables to the landfill uses up limited landfill space and produces methane, which is a powerful greenhouse gas. The region has implemented an organics disposal ban in an effort to divert 70% of its waste from disposal this year. Beginning this month, tipping fees for waste haulers include a 50% surcharge for any loads that contain more than 25% food waste.


The region's green bin programs provide an alternative disposal stream for compostable organics. Food scraps and yard waste collected in household green bins are sent to several municipal composting facilities, including an operation at the Vancouver Landfill, in Delta; Harvest Power, in Richmond; and Net Zero Waste, in Abbotsford. These and other commercial composting facilities in the region help close the nutrient loop by generating natural fertilizer for the region's farms.

I visited the Harvest Power facility in Richmond in February. I was impressed by the scale of the operation, with its capacity to process 240,000 tons of organic waste into compost and biogas annually. I was grateful when the managers offered to donate compost for the student's terrace gardens at KPU's Richmond campus.

Soon after visiting the Harvest Power site, I was contacted by a representative of Net Zero Waste, who also offered to donate compost for the terrace garden project. Since we had two sources of donated municipal compost available, I asked the students to conduct a randomized and replicated experiment to compare the composts, and uncomposted control plots, in terms of crop productivity. We expected the results to be useful to our program, and to regional farmers selecting composts for soil improvement.

Methods

The two terraces east of the Richmond campus entrance were divided into 12 plots, each measuring 1 m by 3 m (Fig. 1). Plots were grouped into two blocks on each terrace, with the three plots nearest the trees in the southeast corner of campus grouped together, to control for possible terrace and shade effects.

Plots in each block were randomly assigned to one of three treatments: 1) Control (no compost); 2) Soil Amender compost from Harvest Power; or 3) Boost compost from Net Zero Waste. Neither compost was blended with sand or topsoil. Composts were applied as a 15 cm mulch layer on top of sandy soil in early April (Fig. 2).

Figure 1. Compost trial location and experimental layout.

Figure 2. Compost trial location before planting. Compost had yet to be applied
to the Net Zero plots in the upper terrace when this image was taken on April 10th.

On April 15th each plot was direct seeded with a row of lettuce (Lactuca sativa cv. 'Drunken Woman'), a row of spinach (Spinachia oleracea cv. 'Savoy'), and a row of Swiss chard (Beta vulgaris cv. 'Pink Flamingo). Rows were spaced 25 cm apart. Plots were irrigated by sprinkler as needed.

Lettuce and spinach were harvested on June 7th (Fig. 3; 53 days after seeding) and Swiss chard was harvested on July 8th (84 days after seeding). All plants were counted and weighed at harvest to calculate total yield, density, and average plant weight. Data analysis was conducted using the R statistical computing environment (Raw data and R coding in Addendum).

Figure 3. Lettuce and spinach harvest, June 7th.


Results

Compost treatment influenced total yield (Fig. 4), yield of individual crops (Figs. 4, 5), and average plant weight (Fig. 6), but not plant density (Fig. 7). Yield and average plant weight were highest in plots amended with compost from Net Zero Waste, and lowest in unamended Control plots. Swiss chard accounted for 72% of the biomass harvested from the study area (Fig. 4), so had a disproportionate influence on the total yield, but similar trends were observed across crops (Fig. 5).

Median values and distributions are compared using 'box and whiskers' charts (interpret) in Figures 4-7.

Figure 4. Total yield of lettuce, spinach, and Swiss chard in unamended
control plots (Ctrl) and plots amended with compost from
Harvest Power (HP) or Net Zero Waste (NZ).


Figure 5. Yield of lettuce, spinach, and Swiss chard in unamended
control plots (Ctrl) and plots amended with compost from
Harvest Power (HP) or Net Zero Waste (NZ).


Figure 6. Average plant weight in unamended control plots (Ctrl) and plots
amended with compost from 
Harvest Power (HP) or Net Zero Waste (NZ).Weight differed by compost source (left) but not replicate.

Figure 7. Plant count at harvest in unamended control plots (Ctrl)
and plots 
amended with compost from Harvest Power (HP) or
Net Zero Waste (NZ). Count 
differed by replicate (right) but not
between compost treatments.

Discussion

Compost improved yield of lettuce, spinach, and Swiss chard. The composts from Harvest Power and Net Zero increased yields by 360% and 700% of the control, respectively. Pronounced yield differences between the treatment and control plots suggest severe nutrient deficiency in the absence of compost, consistent with the low nutrient holding capacity of the high sand, low organic matter soil at the site before treatment. Germination and survival of the direct-seeded crops were similar across treatments, but weight at harvest differed between treatments, suggesting that compost treatment and compost source influenced plant growth.

Compost analysis is needed to determine why crop growth rates differed between the composts tested. Differences in nutrient content, pH, and salinity could all contribute to yield differences such as those observed in this trial.

Acknowledgements

Thanks to Harvest Power and Net Zero Waste for donation of composts used in this trial, and in the remainder of KPU's Richmond campus terrace gardens.


Addendum: Data analysis and presentation in R

A data table called 'Compost' was constructed in R.

Each row of the table contained the following 14 data points for a single plot:
  1. Rep: One of four blocks, labeled A, B, C, or D
  2. Treat: One of three treatments, labeled Ctrl (Control), HP (Harvest Power), or NZ (Net Zero)
  3. letwt: Combined weight of all lettuce, in grams
  4. spiwt: Combined weight of all spinach, in grams
  5. chawt: Combined weight of all Swiss chard, in grams
  6. letcnt: Number of lettuce plants harvested
  7. spicnt: Number of spinach plants harvested
  8. chacnt: Number of chard plants harvested 
  9. letavg: Average weight of a lettuce plant, in grams (letwt/letcnt)
  10. spiavg: Average weight of a spinach plant, in grams (spewt/spicnt)
  11. chaavg: Average weight of a chard plant, in grams (chawt/chacnt)
  12. totwt: Total weight of all plants, in grams (letwt + spiwt + chawt)
  13. totcnt: Total number of plants harvested (letcnt + spicnt + chacnt)
  14. Plantwt: Average plant weight, in grams (totwt/totcnt)

The null hypothesis that compost source had no effect on total yield was tested by ANOVA. The null hypothesis was rejected, and means were separated by Tukey's Honestly Significant Difference test, which found significant differences between all treatments.
> Compost.aov <- aov(totwt ~ Treat + Rep, data=Compost)
> summary(Compost.aov)
> TukeyHSD(Compost.aov) 

The null hypothesis that compost source had no effect on plant density was tested by ANOVA. The null hypothesis could not be rejected but a significant replicate effect was detected.
> Count.aov <- aov(totcnt ~ Treat + Rep, data=Compost)
> summary(Count.aov)

The null hypothesis that compost source had no effect on plant weight was tested by ANOVA. The null hypothesis was rejected, and means were separated by Tukey's Honestly Significant Difference test, which found significant differences between the two compost treatments, and between Net Zero compost and the Control.
PlantWt.aov <- aov(PlantWt ~ Treat + Rep, data=Compost)
> summary(PlantWt.aov)
> TukeyHSD(PlantWt.aov)

Figures 4-7 were generated using the following code:
  • Figure 4:
> par(mfrow=c(1,2))
boxplot(totwt~Treat, data=Compost, main="Total yield", xlab="Compost source", ylab="Weight (g)")
> barplot(MeanWt, main="Yield by crop", xlab="Compost source", ylab="Weight (g)", ylim=c(0, 5000), legend.text=c("Lettuce", "Spinach", "Chard"), args.legend = list(x="topleft"))
  • Figure 5:
> par(mfrow=c(1,3))
> boxplot(letwt~Treat, data=Compost, main="Lettuce yield", xlab="Compost source", ylab="Weight (g)")
> boxplot(spiwt~Treat, data=Compost, main="Spinach yield", xlab="Compost source", ylab="Weight (g)")
> boxplot(chawt~Treat, data=Compost, main="Chard yield", xlab="Compost source", ylab="Weight (g)")
  • Figure 6:
> par(mfrow=c(1,2))
plot(PlantWt~Treat+Rep, data=Compost, ylab="Weight (g)")
  • Figure 7:
> par(mfrow=c(1,2))
plot(totcnt~Treat+Rep, data=Compost, ylab="Plant count")

Tuesday, July 14, 2015

Are conventional blueberries bad for me?

Mom sent me an email with questions about blueberries:
I eat blueberries almost every day ... a handful at breakfast....if I eat regular berries constantly will I end up poisoned? Last year I bought some organic..not a lot...the price difference is startling.
I'm so glad my Mom eats blueberries every day, whether they're organic or conventional. The health benefits of eating blueberries far outweigh the possible risk associated with pesticide residues on those berries. According to one estimate, if everybody in the USA ate one more serving of fruits and vegetables daily the number of cancer cases would fall by about 20,000, while only 20 new cases would occur due to increased pesticide consumption. If you can't find organic blueberries, or can't afford them, it would be far better to switch to conventional berries than to eat fewer blueberries.

Blueberries are a wonderful healthy food, low in calories but rich in vitamins, minerals, and fiber. They are also loaded with antioxidants, which help our bodies ward off cancers and heart disease. Organic blueberries have even more antioxidants than conventional blueberries (this is a common finding when organic and conventional fruits and vegetables are compared generally).

Organic blueberries had about 50% more antioxidant activity than
conventional blueberries in tests conducted in New Jersey. Anthocyanins
and polyphenols are both groups of antioxidants that help prevent
cardiovascular disease and cancer. (Data from Sciarappa 2008,
click to enlarge).

People who buy organic food often think of it as pesticide free. That isn't quite true, because some naturally-derived pesticides are allowed for use on organic farms, and some pesticides might move from conventional to organic farms, or persist from the days before a farm became organic. That said, most organic produce carries far less pesticide residue than conventional produce, and eating organic food dramatically reduces dietary exposure to pesticides. This is partly because so many more chemicals are allowed for use on conventional farms than organic.
Pesticides allowed for use use on conventional blueberry farms in British Columbia. Naturally-sourced active ingredients, which some organic certifiers allow for use on organic farms, are marked with an asterisk (*) (BC Blueberry Production Guide, 2015).
Herbicides Insecticides Fungicides
1. bentazon 23. acetamiprid 44. azoxystrobin
2. carfentrazone-ethyl 24. Bacillus thuringiensis* 45. Bacillus subtilis*
3. clethodim 25. bifenthrin 46. boscalid
4. clopyralid 26. carbaryl 47. captan
5. dichlobenil 27. chlorantraniliprole 48. chlorothalonil
6. dimethylamine salt 28. cyantranilipole 49. copper oxychloride
7. fluazifop-p-butyl 29. deltamethrin 50. cyprodinil
8. flumioxazin 30. imidacloprid 51. fenbuconazole
9. glufosinate ammonium 31. lime sulfur* 52. fenhexamid
10. glyphosate 32. malathion 53. ferbam
11. halosulfuron 33. methoxyfenozide 54. fixed copper*
12. hexazinone 34. novaluron 55. fluazinam
13. mesotrione 35. phosmet 56. fludioxinil
14. metolachlor 36. pymetrozine 57. fluzinam
15. metribuzin 37. pyrethrin* 58. fosetyl-AI
16. napropamide 38. spinetoram 59. metalaxyl-M
17. oxyfluorfen 39. spinosad* 60. metconazole
18. paraquat 40. spirotetramat 61. potassium salts of phosphoric acid
19. rimsulfuron 41. thiamethoxam 62. propiconazole
20. sethoxydim
63. prothioconazole
21. simazine Molluscicides 64. pyraclostrobin
22. terbacil 42. ferric phosphate* 65. Reynoutria sachalinensis extract*

43. metaldehyde 66. triforine
Many of these pesticides are known or suspected carcinogens, hormone disruptors, neurotoxins, developmental toxins, or bee toxins. A 2006 survey by the David Suzuki Foundation (pdf) found that 60 pesticides allowed for use in Canada, including many of those applied to blueberries, are banned outright in other OECD countries. Canadian regulators also tend to set higher pesticide residue limits than those of other OECD nations, allowing for greater consumer exposure to pesticides.

Even so, it would be almost impossible to eat enough blueberries to experience acute toxicity from residues of any single pesticide applied to blueberries. Consider the fungicide boscalid, a possible carcinogen, and the most frequently detected pesticide on samples of blueberries collected in the USA and analyzed by the USDA in 2008. Boscalid was detected on half of the conventional blueberries grown in the USA, and a quarter of imported conventional blueberries, but none of the organic blueberries. According to the EPA, a 20 kg child would have to eat more than twice his weight in boscalid-contaminated conventional blueberries daily before risking acute boscalid toxicity.

Pesticide residue limits are set cautiously for each pesticide and crop. The challenge is that conventional growers rarely use just one pesticide, consumers don't eat just one crop, and each of us reacts differently to the things we eat. That leaves each of us ingesting our own unique and untested cocktail of pesticides, with unknowable results. Current scientific papers examining effects of pesticides on human health note the complexity of assessing risk from pesticide mixtures, leading some to urge an agricultural transition to agro-ecological farming without pesticides.

The people most at risk from pesticides used on blueberries are not those who eat the blueberries, but the farmers and farm-workers who work in the blueberry fields. Canadian farmers face a higher risk of cancers such as Non-Hodgkins Lymphoma than the rest of the population. The more pesticides they use, the greater the risk. Safety protocols help reduce this risk, but the pesticide labels that spell out required protocols can be long and complicated (like labels on prescription medications), so some farmers might not follow them precisely. I once had the disturbing experience of helping a third grade student read pesticide labels so that he could interpret them for his father, who owned a Fraser Valley blueberry farm but did not speak or read English. I have no idea how much of the crucial information was lost in translation.

The vast majority of the pesticides applied to blueberries do not end up on the fruit. Most herbicides, for example, are applied before fruit set, targeting the soil surrounding the blueberry bushes. The pesticides move through the environment with wind and rain. Some end up in groundwater, surface waters, soil, and air. Some decompose rapidly after application; others can persist for years. They may have negative effects on birds, bees, amphibians, beneficial insects, and other non-target organisms. Neonicitonoid insecticides such as imidacloprid, commonly applied to blueberries, have drawn particular attention for their environmental persistence and their negative effects on honeybees and other beneficial insects. They might not harm the person who buys the blueberries directly, but they have an environmental impact.

Organic farming involves much more than eschewing synthetic pesticides. Organic farmers develop whole-farm plans intended to promote biodiversity, resource cycling, and ecological balance. They must use natural sources of nitrogen, which is particularly important in the Fraser Valley, where half of blueberry farms have high or very high levels of residual nitrogen, contributing to groundwater contamination.

The price difference between organic and conventional blueberries is indeed substantial. This week, Rodale's Organic Price Report tool says that organic blueberries cost about twice as much as conventional blueberries at wholesale markets in Boston, Las Angeles and Philadelphia, and three times as much as conventional blueberries in San Francisco. Two years ago, an organic grower on Vancouver Island noted that her blueberries were $4.50 per pound while a major grocery chain was charging just $1.78 per pound.

The problem with blueberry prices may not be that organic blueberries are too expensive, but that conventional blueberries are too cheap, due to over-supply in our region. Farmers in British Columbia have been planting more and more blueberries, expecting growing consumer demand to come with growing awareness of the health benefits of the fruit. Blueberry bushes take 5-7 years to reach full production, so planting decisions made years ago influence the blueberry market today. BC now produces more blueberries than any other Canadian province (or US state), with production increasing annually. Almost all of that production occurs in the Fraser Valley.

By some estimates, BC blueberry growers will harvest about 160 million pounds of blueberries this year, roughly 35 pounds for every man, woman, and child in the province. Canadians have become big blueberry eaters, consuming four-and-a-half pounds per person annually -- more than twice as much as a decade ago, and almost twice as much as a typical American eats today. Even so, British Columbians can hardly put a dent in the local blueberry supply. The vast majority of the crop has to be exported out-of-province if it is to be sold at all. Ontario growers complain that they can't compete with cheap BC blueberries, and accuse BC of dumping blueberries on the market below their cost of production. BC blueberry growers are now seeking buyers in China, India, and Southeast Asia.

In the midst of a blueberry glut, organic blueberries can still be hard to find in BC. The BC Blueberry Council, representing more than 800 blueberry growers, lists just 18 farms that are either "organic" or "spray and chemical free." The Certified Organic Associations of BC lists more than 50 organic farms growing blueberries among some 700 certified organic farms in the province. Many of these organic farms are small, diversified operations, selling directly to consumers. Last week I visited the grocery store near my office in peak blueberry season. They featured lots of locally-grown conventional blueberries, but their organic berries were imported.

The relatively high price of organic blueberries is partly due to strong demand and low supply. Growing organic blueberries is also more expensive for the farmer. No herbicides means more hoes to keep weeds at bay. No synthetic fertilizer means managing and spreading composts or manures. Dedicating land to promote biodiversity and provide habitat for beneficial organisms can mean less land for cash crops. Premium prices for organic products may also enable organic farmers to pay farm workers more.

Locally-grown conventional blueberries are plentiful and healthy, but local organic blueberries are even better... for the consumer, for farm workers, and for the environment.

Wednesday, July 8, 2015

Drip irrigation for water conservation

Richmond has had a hot, dry spring. It has rained only twice since class started in mid-May: We had 5 mm on June 2nd, and 3 mm on June 18th. This amounts to zero effective precipitation because 5 mm of rainfall during a dry spell will simply evaporate rather than soaking into the soil to become available to crops.

Meanwhile, unusually high temperatures, clear skies, dry air, and steady winds are combining to create more potential for evapotranspiraton (and greater fire hazard) than this area normally sees in late spring and early summer. If water is available, the plants can use it.

The evapotranspiration model at Farmwest.com currently calculates a 223 mm moisture deficit for south Richmond between May 1st and today, July 8th. The typical moisture deficit for the same period is just a 37 mm.


All of this means we need to irrigate. The campus terrace gardens have a built-in pop-up sprinkler system that has run for an hour each morning since early May. The same system that waters the terrace gardens waters a section of lawn east of the campus entrance.


On July 3rd, Metro Vancouver restricted lawn sprinkler use to once a week to conserve water. The restrictions to not apply to vegetable gardens, but our irrigation system is not designed to separate the vegetable growing area from the lawn.

Sprinkler irrigation systems are typically just 50-70% efficient due to losses from runoff, wind, and evaporation. They also contribute to periods of leaf wetness, which can promote foliar disease.

Last week the class removed six sprinkler heads and replaced them with header lines for drip irrigation. They shut off the remaining sprinklers in the areas growing vegetables. The drip irrigation system should be more than 90% efficient, dramatically reducing water loss due to runoff, wind, and evaporation.


The new system is reducing water consumption without increasing moisture stress in the crops. It has not been without problems, though. During the first few days of operation we saw several blow-outs of irrigation lines and sprinkler heads. The pressure regulators that we used to reduce water pressure in the drip system increased water pressure in the pipes leading to the sprinklers. We've been trouble-shooting these problems one sprinkler at a time.

We excavated the box with a valve for the irrigation system in the west terraces, and reduced the flow to that side. Doing the same thing on the east side of campus will be more difficult because there are several valves, but no single valve controls just the vegetable-growing area.

The crops are looking good, with cucumbers starting to spill over the terrace walls.

Thursday, July 2, 2015

Orchard blackberry removal

We spent last Thursday morning at the KPU orchard at the south end of Gilbert Road.

There is a nice stand of winter wheat in among the garlic maturing at the orchard site. The wheat seed came with a straw mulch that was laid down when the garlic was planted. Both wheat and garlic appear to be thriving, creating an inadvertent polyculture. Researchers in China have reported that garlic mixed with winter wheat reduces grain aphid pressure. 

Sami is conducting an experiment just south of the garlic/wheat polyculture to test Canola Seed Meal and Enterra Natural Fertilizer as possible soil amendments to deter wireworms. He is using wheat as a trap crop to attract the wireworms.

The focus of the morning was blackberry removal. Blackberries had taken over a 20-foot (~6 m) swath along the north fence of the orchard. We want to use that space for flowering perennials. The city had just dropped off a green bin to haul away organic waste for composting, so it seemed like the perfect time to attack the blackberries.

As we beat back the blackberry vines we uncovered several compost piles that had been swallowed by brambles. It looked like people just kept building new composters as the old ones were engulfed.
We bundled the thorny branches in a tarp to haul to the green bin using the front-end loader. Over the morning we cleared about 100 square meters (1/40 ac) of blackberries, and deposited many bundles in the green bin. Now we can keep the brambles down with repeated close mowing along the fence.

TFN Farm School

Last week the class spent Tuesday morning at the Kwantlen TFN Farm School

The school is conducted on a 20-acres site, allowing for larger scale production than the orchard and campus sites that our students have been managing.

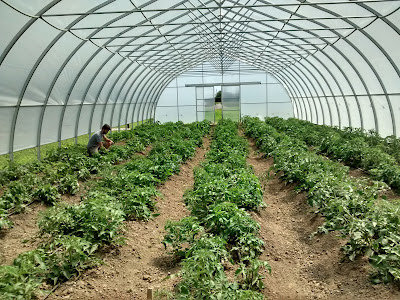
It has two 96-foot high tunnels. One is dedicated entirely to tomato production.

There are a few laying hens already . The farm plan calls for more chickens, along with pigs, goats, and bees.

Vegetable beds are either 100' or 200' long. The cucurbits are grown on black plastic mulch, but the high winds at the site would blow the plastic away if not for the white pipes weighing it down.

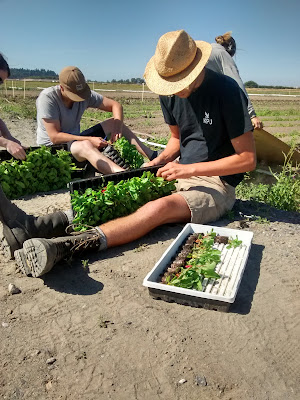
Our students planted flats of seeds, which will germinate and grow in the high tunnel before being transplanted out to the field.

They also popped transplant plugs out of trays...

and transplanted them into freshly-tilled beds.

The silty clay soil tends to crust and crack. Building the organic matter content will take many years.

The students hoed weeds between the rows in the high tunnels 

and in the field.

Potato Harvest

By June 24th many  of the potatoes had died back and some plants had been pulled by people who decided to help themselves to the harvest. The Warbas looked particularly bad. I was surprised to see them senescing before they had flowered, and I didn't expect there to be much underground. I suspected bacterial soft rot, which can be harbored in purslane, the dominant weed at the site.

I dug 8.0 kg of 'Yukon Gold,' 

9.8 kg of 'Warba,'

and 5.9 kg of 'Russian Blue.'

The Warba vines looked the worst among these three varieties, but gave the best yield. The Russian Blue vines looked the best, but gave the lowest yield.

I left the Kennebecs because the vines were still growing vigorously and none of them had been pulled by pilferers. When I returned to campus after the weekend almost all of the Kennebec vines had been pulled, too. Deep human footprints were visible throughout the Kennebec bed, and some potatoes were lying on the soil surface.

Sami dug the Kennebec bed in class this morning, and harvested another 12 kg of potatoes.

Between the four varieties, we collected 35.7 kg of potatoes over 30 square meters, equivalent to 106 hundredweight per acre.

This is almost exactly the same as the assumed yield of 10,000 pounds (100 hundredweight) per acre used as the default yield in the potato enterprise budget recently released by Ermius Afeworki and his coworkers in KPU's Institute for Sustainable Food Systems. The potato enterprise budget is part of a series of enterprise budgets designed for small-scale mixed vegetable farms selling directly to consumers.

According to Statistics Canada, BC potato farms typically yield nearly 300 hundredweight per acre (Canadian Potato Production pdf).  Our yield was low by provincial standards, but similar to the yield that other small-scale diversified farmers told us to expect. Of course, we have no way of knowing how much of our crop was pilfered before our final harvest.